 Nima Leclerc
Explained · 02 · Cornell senior honors thesis
Why is electronic noise “pink”?
A measurement and a simulation aimed at the origin of 1/f noise in nitride transistors, the hum that limits sensitive electronics.
The problem
Every electronic device hums. Part of that hum is white noise, equally loud at all frequencies. But at low frequencies almost every material shows something else: noise whose power climbs as the frequency falls, roughly as 1/f. It was first seen in vacuum tubes, and decades later there is still no single agreed explanation. It matters because it sets the floor for slow, precise measurements, from radio receivers to quantum sensors.
Two classic explanations compete. One says the number of charge carriers flickers (carriers get trapped and released). The other, due to Hooge, says the mobility, how easily carriers move, flickers. Telling them apart in a given material is the point.
What I did
I worked on gallium nitride transistors in the groups of Huili Grace Xing and Debdeep Jena at Cornell. Their channel is a two-dimensional electron gas, a razor-thin sheet of electrons trapped at an AlGaN/GaN interface. The same family of materials can also host a two-dimensional hole gas, which is of interest for complementary nitride electronics.
Measurement. I biased a transistor, filtered and amplified the tiny current fluctuations, and recorded their spectrum.
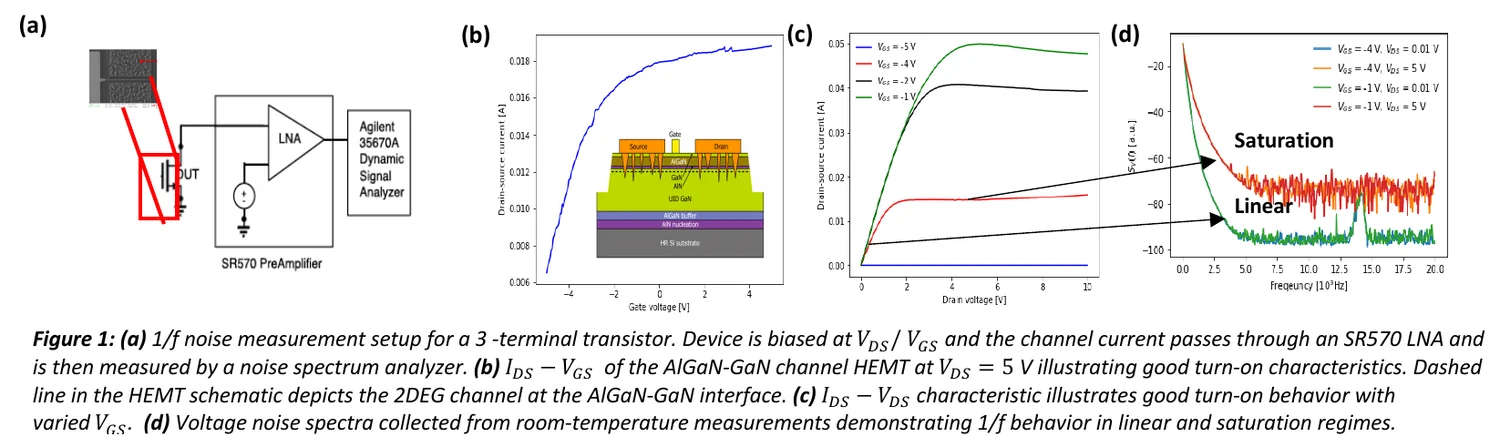
The spectra follow 1/f below roughly 5 kHz, and the noise power grows with the square of the applied voltage, as expected. It barely changed with gate voltage, which would suggest carrier-number fluctuations are not the story, but that disagrees with earlier work on similar devices. My reading was that the instrument’s own noise floor was hiding the effect, so the measurement alone could not settle the question.
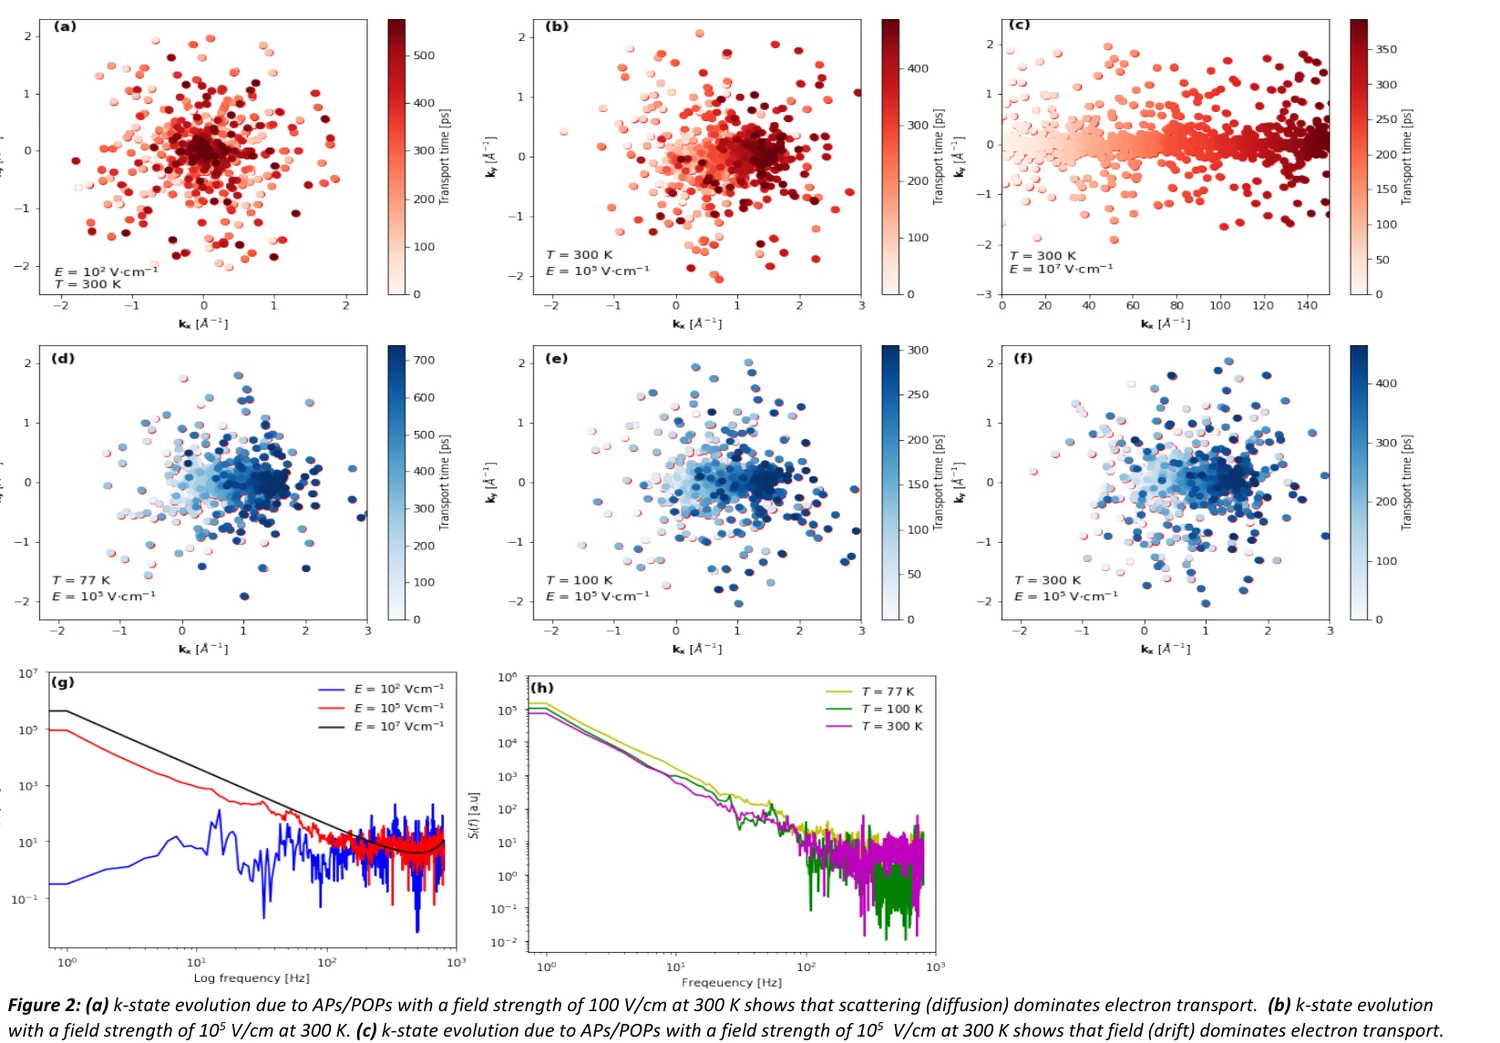
Simulation. So I built a model. It is a Monte Carlo simulation that follows electrons through momentum space: an electric field pushes them steadily (drift), and collisions with lattice vibrations (acoustic and polar optical phonons) knock them to new states at random (diffusion). From the record of how the current fluctuates over about 100 picoseconds, the code computes the noise spectrum.
What came out
- At low field, diffusion from scattering dominates. At high field, drift dominates, and the electrons stream along the field.
- The simulated noise spectrum shows a clear power-law, 1/f-like trend, and it grows as the temperature drops, which is the kind of dependence you can test in the lab.
Honest status
This was an undergraduate thesis. The simulation models only two scattering mechanisms, and the measurement was limited by the instrument. Its value was in the method: a stochastic transport model that links a specific microscopic process to a measurable noise spectrum, and that can be extended from electrons to holes. The same habit, building a model of the device so that you can ask what limits it, runs through my later work on quantum sensors.